Detailed setup description
We would like to measure the reflectivity and transmittivity of UV light on samples of detector materials. Also, we want to investigate if there is any fluorescence. Here we describe in detail how we would like our setup to work, and what needs to be done for that. [PLEASE ADD ANYTHING YOU CAN THINK OF!]
Samples of detector materials
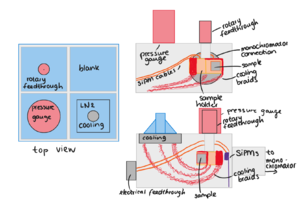
The samples that we would like to study the optical properties of, are materials used in (large scale) liquid xenon dark matter experiments (or other experiments using the same principle). We would like to investigate how the UV scintillation light generated by events in the liquid xenon interacts with the walls of the detector. We need to be able to place the samples into our experiment without touching the face of the sample, and we need to be able to measure for different angles of incoming light. A sample holder has been designed by Casimir van der Post for this purpose. Samples need to be maximally 4mm thick, and measure 3x3cm.
UV light
Xenon scintillation light has a wavelength of 178 nm. Argon scintillation light has an even shorter wavelength of 128 nm. We do not want to use any xenon or argon in this experiment so we use a deuterium lamp and a monochromator to generate light with wavelengths in the UV region. The light will pass through a magnesium fluoride window from the lamp into the monochromator. Inside the monochromator, a reflective grating selects a specific wavelength. We can tune the wavelength using the stepper motor in the monochromator. The size of the beam can be controlled by the size of the entrance and exit slits of the monochromator.
UV light is absorbed by oxygen, therefore we perform the experiment inside a vacuum chamber. For a large enough intensity, we need a vacuum of less than 1x10^-5(one times ten to the power minus five) mbar (see Pressure Requirements below). We use a vacuum pump to pump the vacuum chamber, so the components of the chamber, as well as the components inside the chamber need to be cleaned (dust or lint could break the pump, as well as contaminate the reflective grating or window in the monochromator). Depending on the loss of intensity over one measurement, we could use a cold trap to catch hydrocarbons before they can coat the window from the lamp. We have a pressure gauge to monitor the pressure inside the vacuum chamber which needs to be read out.
Fluorescence of the material will not be in the UV range. We have two different non-UV sensitive (6x6mm) SiPMs for measuring fluorescence.
[ADD SOMETHING HERE ABOUT FILTERS?]
Measure
The reflected or transmitted light of the sample will be measured using (an array of) special UV sensitive silicon photomultipliers (SiPM). For fluorescence measurements we can use normal SiPMs. The SiPMs will be mounted on a sensor holder that can be rotated around the sample holder so we can measure the distribution of light. The intensity of light is expected to be low, so we would like to be able to see single photons. For the fluorescence measurement, we expect such low numbers of photons, we would like to be able to integrate light levels over a half-sphere facing the sample. Since we have only two SiPMs, they will be mounted facing the sample at an angle, letting the beam pass through a small space between the two SiPMs. In the reflection measurement, the angle of the SiPM with respect to the sample needs to be registered, as well as the distance from the sample. Observing the geometry of the sensors and samples, this is not straightforward! In all of the situations, the signal from the SiPMs goes through wires through the vacuum to the feedthroughs. We need to get the signal from the vacuum chamber to the outside without introducing too much noise. Then, outside the vacuum chamber, we need to filter and amplify the SiPM signal and count single photoelectron peaks. Since the SiPM dark count rate is very sensitive to temperature, we also need to measure the temperature inside the vacuum chamber.
Simple model of the setup and light reflection
A basic model of the setup is created in Python. The sizes should be exact. The light paths and angle of the sensor holder are calculated. We see that the range of angles that can be measured is limited. On the one hand by the sensor holder running into the wall of the vacuum chamber, and on the other hand by the light beam running off the sample. The range of angles we can measure is approximately 29 to 41 degrees.
Pressure requirements
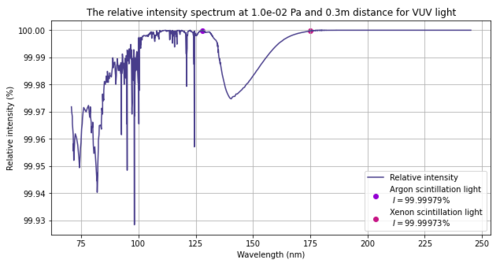
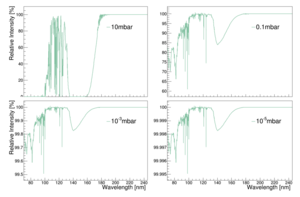
UV light is absorbed by oxygen. The attenuation can be calculated according to mu(P) = rho(P) x sigma x Na / M. Where rho is the pressure dependent density of oxygen in air, sigma is the absorption cross section, Na is Avogadro's number and M the molar mass of oxygen. According to the ideal gas law we get for rho(P) = P * 0.2094 * M / (R*T) . Here we assume a percentage of oxygen in air of 20.94%. This gives mu(P) = 0.2094 * P * sigma * Na / (R*T). For both light at 128nm and at 175nm we will use a cross section of 1*10^-22 m^2. Na = 6.02*10^23, R=8.31 and T=293 K. So, we get an attenuation length of mu(P) = P * 0.2094 * 1*10^-22 * 6.02*10^23 / (8.31*293) = P *12.6 / 2434.8 = 0.0052 * P per meter. We then use I/I0 = e^(-mu*d), where d is the distance the light travels. When we set I0 to a 100, we get the percentual intensity that is left at a certain distance.
| Pressure | Intensity at 50cm | Intensity at 30cm | Intensity at 15cm |
|---|---|---|---|
| 10^5 Pa or 1bar | 0% | 1.8*10^-66% | 1.3*10^-32% |
| 10^2 Pa or 1mbar | 77.1% | 85.6% | 92.5% |
| 10^-1 Pa or 10^-3mbar | 99.97% | 99.98% | 99.99% |
| 10^-3 Pa or 10^-5mbar | 99.9997% | 99.9998% | 99.9999% |


