Difference between revisions of "Dark count measurements"
m |
m (Link to dark count dependence on temperature) |
||
| (3 intermediate revisions by the same user not shown) | |||
| Line 2: | Line 2: | ||
== VUV SiPM 1821 == | == VUV SiPM 1821 == | ||
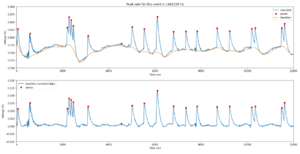
| − | On 17-11-2022 we recorded with a room temperature of 17 degrees Celcius. We took 20 times a set of 1000 waveforms and 1 set of 10,000 waveforms at a pressure of 7.4x10^-5 mbar. We also took two noise runs where after starting the run normally, the SiPM bias was turned off. We select single photo-electron peaks with a simple threshold argument, and compute the rate of all combined dark count data. This gives us a dark count rate of 1.4+-0.3 MHz. | + | On 17-11-2022 we recorded with a room temperature of 17 degrees Celcius. We took 20 times a set of 1000 waveforms and 1 set of 10,000 waveforms at a pressure of 7.4x10^-5 mbar. We also took two noise runs where after starting the run normally, the SiPM bias was turned off. We select single photo-electron peaks with a simple threshold argument, and compute the rate of all combined dark count data. This gives us a dark count rate of 1.4+-0.3 MHz. The rate is in agreement with what we would expect. Note that the dark count distribution is rather broad for a Poisson proces. |
| − | [[File:DcrunVUV1821 2 890.png | + | [[File:DcrunVUV1821 2 890.png|thumb|VUV SiPM 1821: This is a plot of the raw data. A simple peak-finding algorithm is used to find the peaks (indicated by the red dots). A baseline is fitted (orange) and subtracted to produce the bottom plot.|alt=]] |
| − | |||
| − | |||
| − | |||
| − | |||
| − | |||
| − | |||
| − | |||
| − | |||
| − | |||
| − | |||
| − | |||
| − | |||
| − | |||
| − | |||
| − | |||
| − | |||
| − | |||
| − | |||
| − | |||
| − | |||
| − | |||
| − | |||
| − | |||
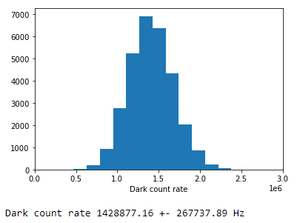
| + | [[File:DCrate VUV1821.png|thumb|VUV SiPM 1821: A histogram of all combined 30000 waveforms, where the rate for each waveform is calculated separately and based on the single pe pulses.|alt=]] | ||
== VIS SiPM 01 == | == VIS SiPM 01 == | ||
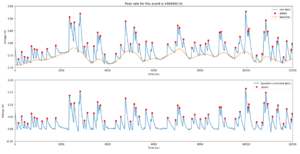
| − | On 18-11-2022 we recorded with a room temperature of 18 degrees Celsius. We took 20 times a set of 1000 waveforms and 1 set of 10,000 waveforms at a pressure of 6.3x10^-5 mbar. We also took two noise runs and one run with the lamp turned on at 400nm and slightly opened slits. Note that the SiPM was in fact behind the sample holder and not directly exposed to any light from the lamp. We select single photo-electron peaks with a simple threshold argument, and compute the rate of all combined dark count data. This gives us a dark count rate of 3.0+-0.4 MHz. | + | On 18-11-2022 we recorded with a room temperature of 18 degrees Celsius. We took 20 times a set of 1000 waveforms and 1 set of 10,000 waveforms at a pressure of 6.3x10^-5 mbar. We also took two noise runs and one run with the lamp turned on at 400nm and slightly opened slits. Note that the SiPM was in fact behind the sample holder and not directly exposed to any light from the lamp. We select single photo-electron peaks with a simple threshold argument, and compute the rate of all combined dark count data. This gives us a dark count rate of 3.0+-0.4 MHz. Also, this rate is in agreement with what we would expect. |
| − | [[File:DcrunVIS1 2 890.png | + | [[File:DcrunVIS1 2 890.png|thumb|VIS SiPM 01: This is a plot of the raw data. A simple peak-finding algorithm is used to find the peaks (indicated by the red dots). A baseline is fitted (orange) and subtracted to produce the bottom plot.|alt=]] |
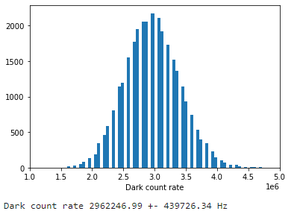
| + | [[File:DCrate VIS01.png|thumb|VIS SiPM 01: A histogram of all combined 30000 waveforms, where the rate for each waveform is calculated separately and based on the single pe pulses.|alt=]] | ||
| − | [[File: | + | == Noise == |
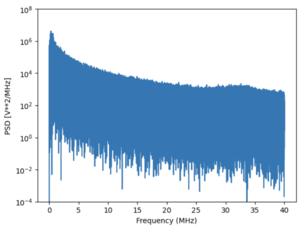
| + | [[File:PSDdigitizer.png|thumb|Figure 1: PSD of the measurement. The sampling is at 12.5ns intervals, so the maximum frequency is 40 MHZ. We expect the dark count rate to be around 1 MHz at room temperature, and this is also where the PSD peaks.]] | ||
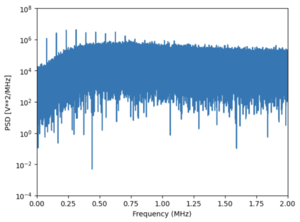
| + | [[File:PSDdigitizer zoom.png|thumb|Figure 2: zoom in of the PSD shown in Figure 1. Some peaks stand out, indicating high noise at these frequencies.]] | ||
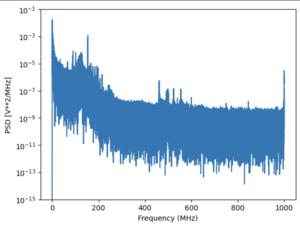
| + | [[File:13degrees PSDoscilloscope.png|thumb|Figure 3: the Power Spectral Density of some data taken with the oscilloscope at 13 degrees. We see that there is a fair amount of noise around 100Mhz.]] | ||
| + | To get some insight in the sources of noise, we computed the power spectral density (PSD). Figure 1 shows the PSD of the dark count measurement taken with the 12.5ns CAEN digitizers. When we zoom in at the region around the peak, some peaks become visible which indicate noise at these frequencies. [[Dark count dependence on temperature|Lucia took some data with an oscilloscope]]. The oscilloscope had a resolution of 0.5ns. Figure 3 shows the PSD of some data taken with this oscilloscope at 13 degrees. This signal shows some high frequency noise, which is also visible in the PSD plot. | ||
Latest revision as of 15:17, 15 February 2023
We want to characterize the dark count rates of each of our individual SiPMs.
VUV SiPM 1821
On 17-11-2022 we recorded with a room temperature of 17 degrees Celcius. We took 20 times a set of 1000 waveforms and 1 set of 10,000 waveforms at a pressure of 7.4x10^-5 mbar. We also took two noise runs where after starting the run normally, the SiPM bias was turned off. We select single photo-electron peaks with a simple threshold argument, and compute the rate of all combined dark count data. This gives us a dark count rate of 1.4+-0.3 MHz. The rate is in agreement with what we would expect. Note that the dark count distribution is rather broad for a Poisson proces.
VIS SiPM 01
On 18-11-2022 we recorded with a room temperature of 18 degrees Celsius. We took 20 times a set of 1000 waveforms and 1 set of 10,000 waveforms at a pressure of 6.3x10^-5 mbar. We also took two noise runs and one run with the lamp turned on at 400nm and slightly opened slits. Note that the SiPM was in fact behind the sample holder and not directly exposed to any light from the lamp. We select single photo-electron peaks with a simple threshold argument, and compute the rate of all combined dark count data. This gives us a dark count rate of 3.0+-0.4 MHz. Also, this rate is in agreement with what we would expect.
Noise
To get some insight in the sources of noise, we computed the power spectral density (PSD). Figure 1 shows the PSD of the dark count measurement taken with the 12.5ns CAEN digitizers. When we zoom in at the region around the peak, some peaks become visible which indicate noise at these frequencies. Lucia took some data with an oscilloscope. The oscilloscope had a resolution of 0.5ns. Figure 3 shows the PSD of some data taken with this oscilloscope at 13 degrees. This signal shows some high frequency noise, which is also visible in the PSD plot.
