Lamp spectrum measurement
Jasmijn measured the spectrum of the deuterium lamp.
Experimental setup
The entrance split opening is 0.25 ± 0.005 mm and the exit slit opening is 0.05 ± 0.005 mm.
The temperature was fairly constant around 15 ± 1 degrees Celcius.
The pressure was fairly constant around 2*10^-4 ± 3*10^-4 mbar.
We allowed the lamp to warm up for 15 minutes before starting the first measurement.
The trigger threshold was set to 7000 ADC counts and the SiPM bias was 57 V.
At wavelengths between 110 nm and 400 nm we took 5000 waveforms for each wavelength.
Each waveform is 13 μs long.
Analysis
A baseline is computed for each waveform with asymmetric least squares (see https://www.researchgate.net/publication/228961729_Baseline_Correction_with_Asymmetric_Least_Squares_Smoothing) and subtracted.
Then the area under the baseline corrected waveform is calculated.
For each wavelength, the mean area and standard deviation is computed.
We normalize the measurements to the peak value, resulting in the uncorrected spectrum.
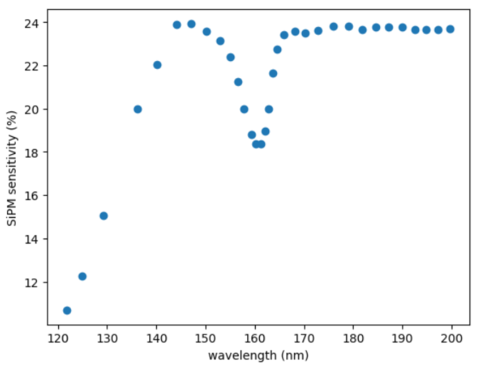
We then correct the spectrum for the SiPM sesitivity. The SiPM sensitivity is taken from the datasheet and used without error. The value at 400 nm is specified as 35% on the datasheet, and the values for 300 nm and 110 nm are found by interpolating.
The corrected spectrum is then compared with the deuterium lamp spectrum provided by Hamamatsu. The measured spectrum is normalized to the value at 164 nm.
We see that the measured spectrum matches the provided spectrum reasonably well. Around the peak we see the effect of saturating the SiPM. At 110 nm no SiPM sensitivity is expected, but still some signal is measured. The rate at 400 nm matches the expected dark count rate. No temperature or air attenuation corrections were performed at this point.


