Difference between revisions of "NL Cloud Monitor Instructions"
| (51 intermediate revisions by 2 users not shown) | |||
| Line 1: | Line 1: | ||
== Introduction == | == Introduction == | ||
| − | This page will give a step-by-step instruction for the shifters (of the ATLAS NL-cloud regional operation) to check through several key monitoring pages used by Atlas Distributed Computing (ADC). Those | + | This page will give a step-by-step instruction for the shifters (of the ATLAS NL-cloud regional operation) to check through several key monitoring pages used by Atlas Distributed Computing (ADC). Those pages are also monitored by official ADC shifters (e.g. ADCoS, DAST). |
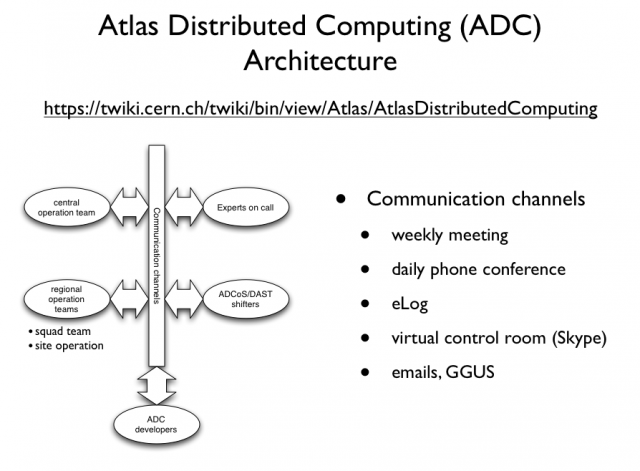
| − | The general architecture of ADC operation is shown | + | The general architecture of ADC operation is shown below. '''The shifters that we are concerning here is part of the "regional operation team". The contribution will be credited by OTSMU.''' |
| − | The shifters that we are concerning here is part of the "regional operation team". The contribution will be credited by OTSMU. | ||
| − | == | + | [[Image:ADC Operation Architecture.png|thumb|center|640px|General architecture of the ADC operation]] |
| + | |||
| + | == Overview of the ADC activities and operation == | ||
| + | https://twiki.cern.ch/twiki/pub/Atlas/ADCOpsPresentationMaterials/20101025_ATLAS-Computing.pdf | ||
| − | + | == Shifter's duty == | |
| + | The shifter-on-duty needs to follow the instructions below to: | ||
| + | # check different monitoring pages regularly (3-4 times per day would be expected) | ||
| + | # notify the NL cloud squad team accordingly via [mailto:adc-nl-cloud-support@nikhef.nl adc-nl-cloud-support@nikhef.nl]. | ||
<!-- Shifters are requested to check those pages as regular as 3-4 times per day (morning, early afternoon, late afternoon/early evening) --> | <!-- Shifters are requested to check those pages as regular as 3-4 times per day (morning, early afternoon, late afternoon/early evening) --> | ||
| + | == Things to monitor == | ||
=== ADCoS eLog === | === ADCoS eLog === | ||
| − | ADCoS eLog is mainly used by ADC experts and ADCoS shifters to log the actions taken on a site concerning a site issues. For example, removing/adding site from/into the ATLAS production system. The | + | ADCoS eLog is mainly used by ADC experts and ADCoS shifters to log the actions taken on a site concerning a site issues. For example, removing/adding site from/into the ATLAS production system. The eLog entries related to NL-cloud can be found [https://prod-grid-logger.cern.ch/elog/ATLAS+Computer+Operations+Logbook/?Cloud=NL&mode=summary here]. |
| − | The | + | '''''The shifter has to notify the squad team if there are issues not being followed up for a long while (~24 hours).''''' |
=== DDM Dashboard === | === DDM Dashboard === | ||
| Line 21: | Line 27: | ||
The main monitoring page is explained below | The main monitoring page is explained below | ||
| − | [[Image:Dashboard explained.png| | + | [[Image:Dashboard explained.png|thumb|center|640px|DDM Dashboard Explanation]] |
There are few things to note on this page: | There are few things to note on this page: | ||
| − | + | # the summary indicates the data transfer "TO" a particular cloud or site. For example, transfers from RAL to SARA is categorized to "SARA"; while transfers from SARA to RAL is catagorized to "RAL". | |
| − | + | # the cloud is label with its Tier-1 name, for example, "SARA" represents the whole transfers "TO" NL cloud. | |
| − | + | # it will be handy to remember that "yellow" bar indicates transfers to NL cloud. | |
| − | |||
| − | |||
To check this page, here are few simple steps to follow: | To check this page, here are few simple steps to follow: | ||
| − | # look at the bottom-right plot (total transfer errors). If the yellow bar persists every hour with a significant number of errors. Go to check the table below. | + | # look at the bottom-right plot (total transfer errors). If the yellow bar persists every hour with a significant number of errors. Go to check the summary table below. |
| − | # To check the | + | # To check the failed transfers to NL cloud, click on the "SARA" entry on the summary table. The table will be extended to show the detail transfers to the sites within NL cloud. From there you can see which site is in trouble. |
| − | # When you identify the destination site of the problematic transfers, you can click on the "+" sign in front of the site, the table will be extended again to show the "source site" of the transfers. By clicking on the number of the transfer errors showing on the table (the 4th column from the end), the error message will be presented. | + | # When you identify the destination site of the problematic transfers, you can click on the "+" sign in front of the site, the table will be extended again to show the "source site" of the transfers. By clicking on the number of the transfer errors showing on the table (the 4th column from the end), the error message will be presented. A graphic instruction of those steps is shown below. |
| − | + | ||
| + | [[Image:DDM find error msg.png|thumb|center|640px|Steps to trace down to the transfer error messages]] | ||
| − | + | '''''The shifter has to report the problem to the [mailto:adc-nl-cloud-support@nikhef.nl NL squad team] when the number of the error is high.''''' | |
| − | # | + | |
| − | # | + | The shifter can ignore reporting problems in case of: |
| − | # | + | # the error message indicates that it's a "SOURCE" error (you can see it on the error message). |
| + | # site is in downtime. The downtime schedule can be found here: http://lxvm0350.cern.ch:12409/agis/calendar/ | ||
| + | # the same error that has been reported earlier during your shift. | ||
=== Panda Monitor (Production) === | === Panda Monitor (Production) === | ||
| + | [http://panda.cern.ch:25980/server/pandamon/query?dash=prod&reload=yes The Panda Monitor for ATLAS production] is used for monitoring Monte Carlo simulation and data reprocessing jobs on the grid. | ||
| + | |||
| + | The graphic explanation of the main page is given below. | ||
| + | |||
| + | [[Image:Panda Monitor Explained.png|thumb|center|640px|Explanation of the Panda main page]] | ||
| + | |||
| + | Here are few simple steps to follow for checking on this page: | ||
| + | |||
| + | # firstly check the number of active tasks in NL cloud versus the running jobs in NL cloud. If the number of active tasks to NL cloud is non-zero; but there is no running jobs. Something is wrong and the shifter should notify [mailto:adc-nl-cloud-support@nikhef.nl the NL squad team] to have a look. | ||
| + | # then look at the job statistics table below. The statistics is summarized by cloud. The first check is on the last column of the NL row indicating the overall job failure rate in past 12 hours. If the number is too high (e.g > 30%), go through the following instructions to get one failed job. | ||
| + | |||
| + | '''How to get job failure''' | ||
| + | |||
| + | Here are instructions to get failed jobs. | ||
| + | |||
| + | # click on the number of failed jobs per site on the summary table. This will guide you to the list of failed jobs with error details. | ||
| + | # try to categorize the failed jobs with the error details and pick up one example job per failure category. | ||
| + | # report to NL squad team with the failure category and the link to an example job per category. | ||
| + | |||
| + | The following picture shows the graphic illustration of those steps. | ||
| + | |||
| + | [[Image:Panda find job error.png|thumb|center|640px|Finding example job and job error in Panda]] | ||
=== Panda Monitor (Analysis) === | === Panda Monitor (Analysis) === | ||
| + | The instruction to check Panda analysis job monitor is similar to what has been mentioned in [[#Panda Monitor (Production)]]. | ||
=== GangaRobot === | === GangaRobot === | ||
| + | [http://gangarobot.cern.ch/ GangaRobot] is a site functional test for running analysis jobs. Sites fail to pass one of the regular tests in past 12 hours will be blacklisted. The user analysis jobs submitted through the gLite Workload Management System (WMS) from [http://cern.ch/ganga Ganga] will be instrumented to avoid being assigned to those problematic sites. | ||
| + | |||
| + | The currently blacklisted site can be found [http://gangarobot.cern.ch/blacklist.html here]. | ||
| + | |||
| + | '''The shifter has to notify the [mailto:adc-nl-cloud-support@nikhef.nl NL squad team] when any one of the sites in NL cloud shows up in the list.''' | ||
| + | |||
| + | === Site blacklists to check === | ||
| + | * Central DDM blacklisting (no transfers to/from those sites): http://bourricot.cern.ch/blacklisted_production.html | ||
| + | * Site exclusion tickets (for tracing site exclusions): https://savannah.cern.ch/support/?group=adc-site-status&func=browse&set=open | ||
| + | * Sites blacklisted by Ganga (Panda sites just for information, WMS sites won't get jobs submitted through WMS): http://gangarobot.cern.ch/blacklist.html | ||
== Shifters' calendar == | == Shifters' calendar == | ||
<!-- here shows the shifter-on-duty --> | <!-- here shows the shifter-on-duty --> | ||
| + | [http://www.google.com/calendar/embed?src=dgeerts@nikhef.nl&ctz=Europe/Amsterdam view the scheduled shifters] | ||
| + | |||
| + | == Quick links to monitoring pages == | ||
| + | <!-- quick links to key monitoring pages --> | ||
| + | * [mailto:adc-nl-cloud-support@nikhef.nl Contact NL squad team] | ||
| + | * [http://bourricot.cern.ch/dq2/accounting/cloud_view/NLSITES/30/ NL cloud storage usage accounting] | ||
| + | * [https://prod-grid-logger.cern.ch/elog/ATLAS+Computer+Operations+Logbook/?Cloud=NL ADC eLog (NL related entries)] | ||
| + | * [http://dashb-atlas-data.cern.ch/dashboard/request.py/site DDM Dashboard (last 4 hours overview)] | ||
| + | * [http://panda.cern.ch:25980/server/pandamon/query?dash=prod&reload=yes Panda production jobs monitoring] | ||
| + | * [http://panda.cern.ch:25980/server/pandamon/query?dash=analysis&reload=yes Panda analysis jobs monitoring] | ||
| + | * [http://panda.cern.ch:25980/server/pandamon/query?dash=clouds&reload=yes#NL Panda queues for NL-cloud sites] | ||
| + | * [http://panda.cern.ch:25980/server/pandamon/query?overview=releaseinfo Panda overview: available Atlas release] | ||
| + | * [http://gangarobot.cern.ch/blacklist.html GangaRobot site blacklist] | ||
| + | |||
| + | <!-- internal monitoring pages ---> | ||
| + | * [http://web.grid.sara.nl/ftsmonitor/ftsmonitor.php FTS monitor: transfers in NL cloud] | ||
| + | * [http://web.grid.sara.nl/monitoring/ Data Management monitoring at SARA] | ||
| − | |||
<!-- some useful links to ADCoS tutorial wikis that are used for official ADCoS shifters --> | <!-- some useful links to ADCoS tutorial wikis that are used for official ADCoS shifters --> | ||
| + | |||
| + | == Quick links for further investigation/operation == | ||
| + | * [https://twiki.cern.ch/twiki/bin/view/Atlas/DDMOperationProcedures#In_case_some_files_have_been_los How to cleanup lost file at site?] | ||
| + | * [https://twiki.cern.ch/twiki/bin/view/Atlas/DDMOperationsScripts DDM Operation Scripts] | ||
| + | * [http://voatlas62.cern.ch/pilots/ log repository of CERN pilot factory] | ||
| + | * [http://etpgrid01.garching.physik.uni-muenchen.de/pilots/ log repository of Rod's pilot factory] | ||
| + | * [http://condorg.triumf.ca/productionPilots log repository of CA pilot factory] | ||
| + | |||
| + | * [https://twiki.cern.ch/twiki/bin/view/Atlas/DDMOperationProcedures DDM operation procedure] | ||
| + | * [https://twiki.cern.ch/twiki/bin/view/Atlas/DDMOperationsScripts DDM operation scripts] | ||
Latest revision as of 16:10, 25 November 2010
Introduction
This page will give a step-by-step instruction for the shifters (of the ATLAS NL-cloud regional operation) to check through several key monitoring pages used by Atlas Distributed Computing (ADC). Those pages are also monitored by official ADC shifters (e.g. ADCoS, DAST).
The general architecture of ADC operation is shown below. The shifters that we are concerning here is part of the "regional operation team". The contribution will be credited by OTSMU.
Overview of the ADC activities and operation
https://twiki.cern.ch/twiki/pub/Atlas/ADCOpsPresentationMaterials/20101025_ATLAS-Computing.pdf
Shifter's duty
The shifter-on-duty needs to follow the instructions below to:
- check different monitoring pages regularly (3-4 times per day would be expected)
- notify the NL cloud squad team accordingly via adc-nl-cloud-support@nikhef.nl.
Things to monitor
ADCoS eLog
ADCoS eLog is mainly used by ADC experts and ADCoS shifters to log the actions taken on a site concerning a site issues. For example, removing/adding site from/into the ATLAS production system. The eLog entries related to NL-cloud can be found here.
The shifter has to notify the squad team if there are issues not being followed up for a long while (~24 hours).
DDM Dashboard
DDM Dashboard is used for monitoring the data transfer activities between sites.
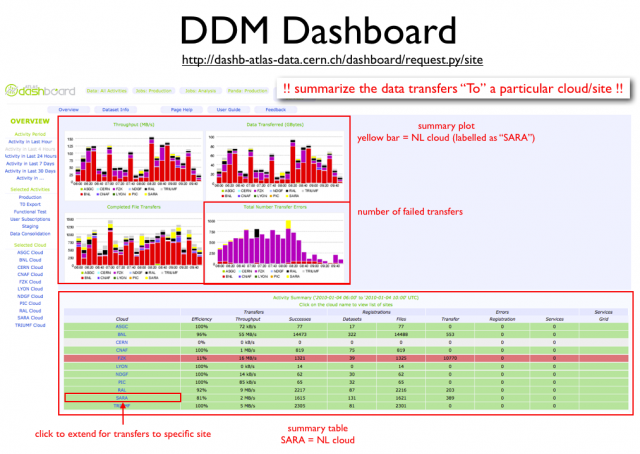
The main monitoring page is explained below
There are few things to note on this page:
- the summary indicates the data transfer "TO" a particular cloud or site. For example, transfers from RAL to SARA is categorized to "SARA"; while transfers from SARA to RAL is catagorized to "RAL".
- the cloud is label with its Tier-1 name, for example, "SARA" represents the whole transfers "TO" NL cloud.
- it will be handy to remember that "yellow" bar indicates transfers to NL cloud.
To check this page, here are few simple steps to follow:
- look at the bottom-right plot (total transfer errors). If the yellow bar persists every hour with a significant number of errors. Go to check the summary table below.
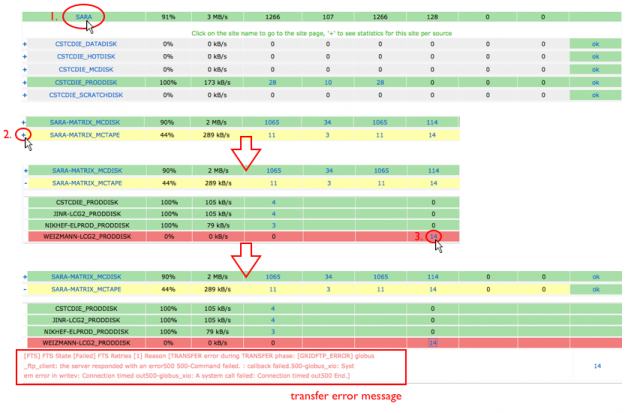
- To check the failed transfers to NL cloud, click on the "SARA" entry on the summary table. The table will be extended to show the detail transfers to the sites within NL cloud. From there you can see which site is in trouble.
- When you identify the destination site of the problematic transfers, you can click on the "+" sign in front of the site, the table will be extended again to show the "source site" of the transfers. By clicking on the number of the transfer errors showing on the table (the 4th column from the end), the error message will be presented. A graphic instruction of those steps is shown below.
The shifter has to report the problem to the NL squad team when the number of the error is high.
The shifter can ignore reporting problems in case of:
- the error message indicates that it's a "SOURCE" error (you can see it on the error message).
- site is in downtime. The downtime schedule can be found here: http://lxvm0350.cern.ch:12409/agis/calendar/
- the same error that has been reported earlier during your shift.
Panda Monitor (Production)
The Panda Monitor for ATLAS production is used for monitoring Monte Carlo simulation and data reprocessing jobs on the grid.
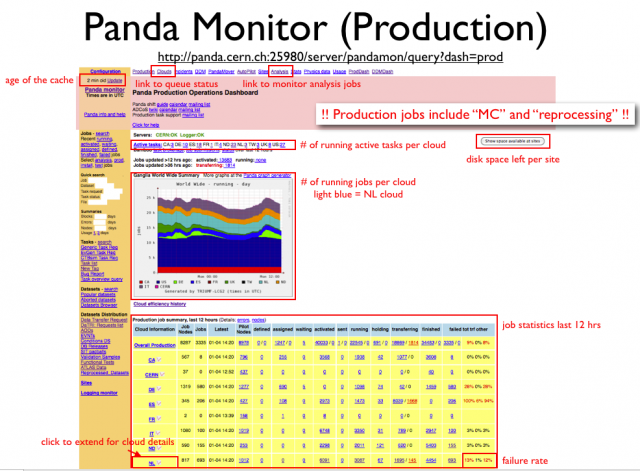
The graphic explanation of the main page is given below.
Here are few simple steps to follow for checking on this page:
- firstly check the number of active tasks in NL cloud versus the running jobs in NL cloud. If the number of active tasks to NL cloud is non-zero; but there is no running jobs. Something is wrong and the shifter should notify the NL squad team to have a look.
- then look at the job statistics table below. The statistics is summarized by cloud. The first check is on the last column of the NL row indicating the overall job failure rate in past 12 hours. If the number is too high (e.g > 30%), go through the following instructions to get one failed job.
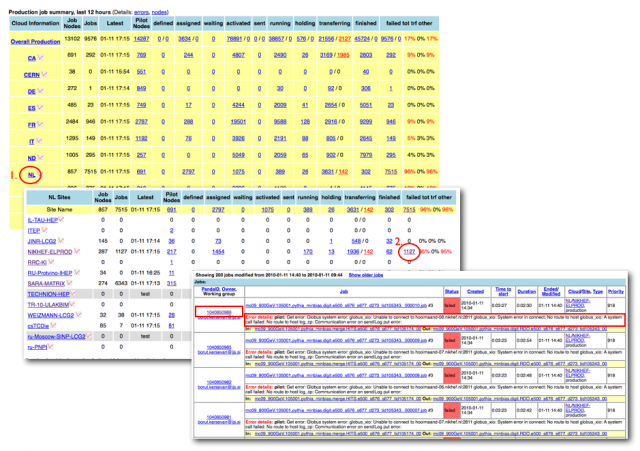
How to get job failure
Here are instructions to get failed jobs.
- click on the number of failed jobs per site on the summary table. This will guide you to the list of failed jobs with error details.
- try to categorize the failed jobs with the error details and pick up one example job per failure category.
- report to NL squad team with the failure category and the link to an example job per category.
The following picture shows the graphic illustration of those steps.
Panda Monitor (Analysis)
The instruction to check Panda analysis job monitor is similar to what has been mentioned in #Panda Monitor (Production).
GangaRobot
GangaRobot is a site functional test for running analysis jobs. Sites fail to pass one of the regular tests in past 12 hours will be blacklisted. The user analysis jobs submitted through the gLite Workload Management System (WMS) from Ganga will be instrumented to avoid being assigned to those problematic sites.
The currently blacklisted site can be found here.
The shifter has to notify the NL squad team when any one of the sites in NL cloud shows up in the list.
Site blacklists to check
- Central DDM blacklisting (no transfers to/from those sites): http://bourricot.cern.ch/blacklisted_production.html
- Site exclusion tickets (for tracing site exclusions): https://savannah.cern.ch/support/?group=adc-site-status&func=browse&set=open
- Sites blacklisted by Ganga (Panda sites just for information, WMS sites won't get jobs submitted through WMS): http://gangarobot.cern.ch/blacklist.html
Shifters' calendar
Quick links to monitoring pages
- Contact NL squad team
- NL cloud storage usage accounting
- ADC eLog (NL related entries)
- DDM Dashboard (last 4 hours overview)
- Panda production jobs monitoring
- Panda analysis jobs monitoring
- Panda queues for NL-cloud sites
- Panda overview: available Atlas release
- GangaRobot site blacklist
