Intensity calculations
Intensity of light in the VUV setup
Intensity of light in the XENON detector
This section describes the first estimates for the level of fluorescence required to explain the single electron signals which are observed after a larger event in the TPC, also named electron trains.
It has been suggested [1] that the fluorescence of PTFE reflectors in the XENON100 and XENON1T detectors could explain the presence of a delayed single electron component. The signal is observed with a delay time of 2.3 ms after a larger observed pulse and could be described by ionisation of oxygen atoms or impurities upon the absorption of a fluoresced photon from the PTFE. This photon would need to be in the infrared region and therefore invisible to the PMTs in the detector, but in principle could have enough energy to liberate electrons upon absorption.
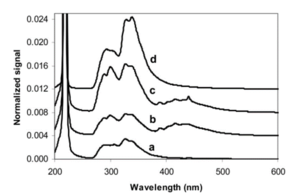
This statement is taken as a basis for the initial estimation into how much the PTFE in the XENON detector would need to fluoresce in order to be a viable candidate for the origin of this observed background. PTFE has been shown to fluoresce in the visible region [2-6] between 250 nm and 500 nm at room temperature as shown in Figure 1. The cryogenic, low-temperature effect of PTFE fluorescence spectra is yet unknown and has the possibility to show a new structure in the infrared wavelengths region above 780 nm.
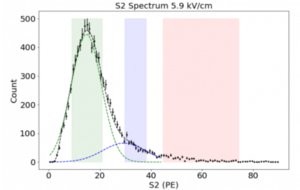
The distribution shown in Figure 2 indicates that most single electron signals are detected with roughly 15 PE with a maximum count around 475 per electron train. We will take this as a starting number for these initial calculations. [7] indicates that these trains can occur with up to 10^6 single electron signals.
The energy required to ionise an oxygen molecule is 0.45 eV, so any photon released during fluorescence with a wavelength up to 2 um would be energetic enough to ionise. This is well within a reasonable energy range for fluorescence observed from PTFE previously. The reflectivity of PTFE is given as 95% in [8], so we will (conservatively) assume that 5% of the photons that hit the detector walls are absorbed and can be fluoresced. The next assumption we will make is that the initial event occurred in the centre of the detector, giving the PMT solid angle coverage in XENON1T as roughly 50%.
Electron trains follow many different events in the detector from radioactivity events to scattering events. For this example, we will assume that the initial event produces 10^6 scintillation photons. Therefore, if 50% of these photons collide with the detector wall and 5% of those photons are absorbed for fluorescence, to reach the 475 single electrons in the train, the PTFE would require a fluorescence quantum yield of 0.02.
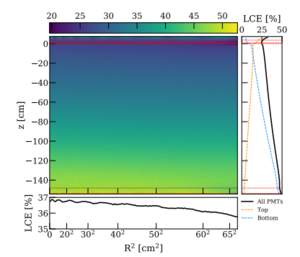
The Light Collection Efficiency (LCE) of the top PMT array in XENONnT is shown in Figure 3. This averages at 35% due to the reflective properties of the interface between liquid and gaseous xenon. Whilst this is shown for XENONnT, it is very similar to the XENON1T LCE levels. Using this number, the fluorescence quantum yield is increased to 0.06.
We shall conservatively assume that only 50% of the fluoresced photons go on to ionise oxygen molecules in the liquid xenon volume. This also increases the fluorescence quantum yield to nearly 0.11.
We therefore require 11% of the absorbed photons from an event of 10^6 photons to be fluoresced in order to explain the origin of the single electron signals observed in electron trains.
| Reference number | Reference |
|---|---|
| 1 | P. Sorensen and K. Kamdin, “Two distinct components of the delayed single electron noise in
liquid xenon emission detectors,” Journal of Instrumentation, vol. 13, pp. P02032–P02032, feb 2018. |
| 2 | P. Shaw, Z. Li, U. Arp, and K. Lykke, “Ultraviolet characterization of integrating spheres”, Applied optics, vol. 46, pp. 5119–28, 2007 |
| 3 | E. Peik, “Long-lasting photoluminescence in polymers,” Hournal of Physics D: Applied Physics,
vol. 40, no. 11, pp. 3330–3334, 2007 |
| 4 | P. Shaw, Z. Li, U. Arp, and K. Lykke, “Ultraviolet characterization of integrating spheres,”, Applied optics, vol. 46, pp. 5119–28, 2007 10 |
| 5 | G. Araujo, "Wavelength Shifting and Photon Detection of Scintillation Light from Liquid Argon", PhD thesis, 03 2019 |
| 6 | Araujo, G. R., Pollmann, T., Ulrich, A., "Photoluminescence response of acrylic (pmma) and polytetrafluo-roethylene (ptfe) to ultraviolet light,” The European Physical Journal C, vol. 653 79 8, pp. 1434–
6052, 2019 |
| 7 | A. Kopec, “Extraction field effect on electron train backgrounds in asterix”, XENON wiki |
| 8 | Cyril, “Study of lce with the v305 of the code,”, XENON wiki |
| 9 | The XENON Collaboration, "Projected WIMP sensitivity of the XENONnT dark matter experiment,”
Journal of Cosmology and Astroparticle Physics, vol. 2020, pp. 031–031, nov 2020. |


