IdealVac
Jump to navigation
Jump to search
This page contains the information about the Vacuum chamber as well as the files associated.
The Chamber
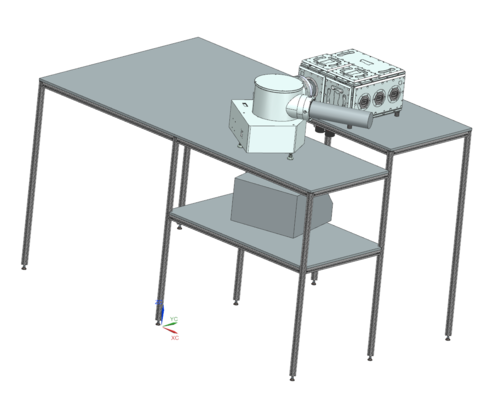
The chamber is designed by Jeroen van den Borgh and the design is altered by dr. Tina Pollmann and Casimir van der Post to fit the needs of future experiments better. The design of the chamber can be seen below. This brand of vacuum chamber is chosen for this experiment because of its modularity. Side plates and feedthroughs can be easily changed to fit the needs for a certain experiment. The feedthroughs and connections will be supplied by pfeiffer, think of the rotary feedthroughs and electrical feedthroughs. But also the connection to the monochormator and the vacuum pump will be from pfeiffer.
Design
