File:Graph high range.png
Jump to navigation
Jump to search
Size of this preview: 800 × 481 pixels. Other resolutions: 320 × 192 pixels | 1,653 × 993 pixels.
Original file (1,653 × 993 pixels, file size: 26 KB, MIME type: image/png)
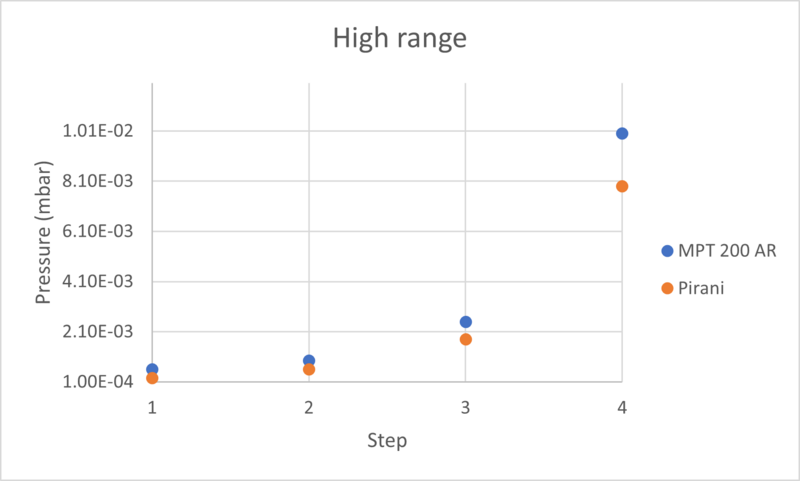
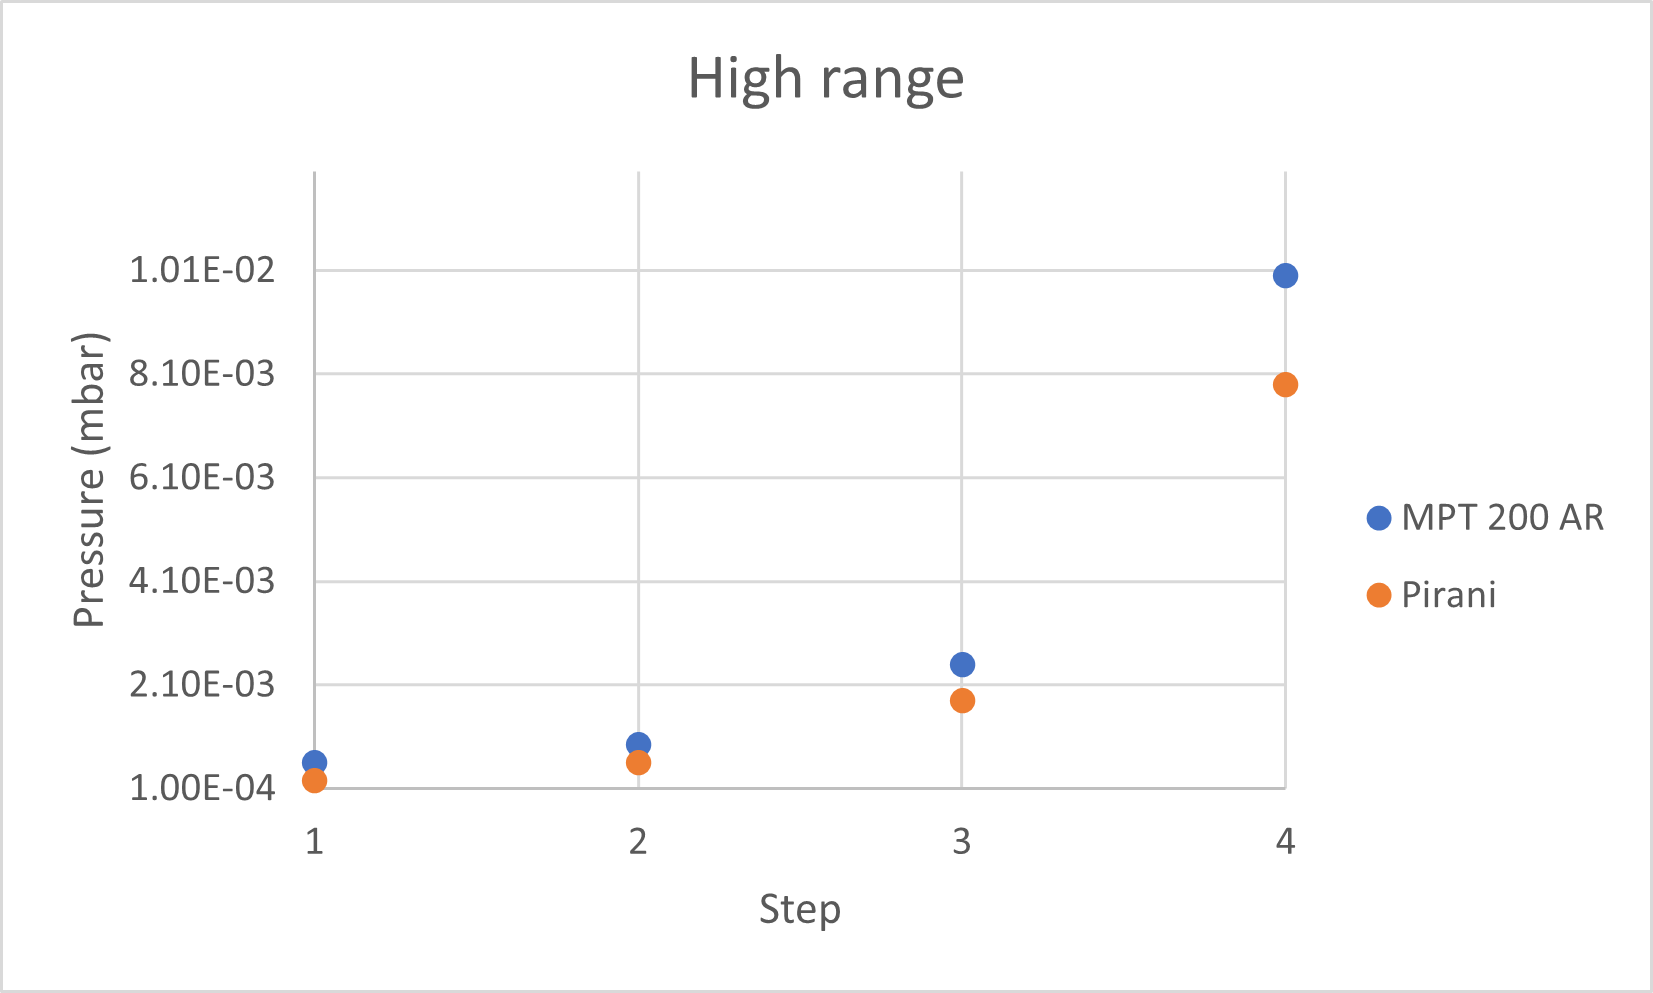
Graph of pressure readings from the sensor compared to a calibrated pressure sensor.
File history
Click on a date/time to view the file as it appeared at that time.
| Date/Time | Thumbnail | Dimensions | User | Comment | |
|---|---|---|---|---|---|
| current | 08:58, 12 October 2023 | | 1,653 × 993 (26 KB) | Mnuland@nikhef.nl (talk | contribs) |
You cannot overwrite this file.
File usage
The following page uses this file: